Wednesday, March 12, 2014

Simulation Modeling and Analysis of Computer Networks Assigment 3


ASSIGNMENT # 03


TOTAL MARKS 10
Question No. 01 (10)
  1. Write the performance comparison of different browsers using automated tools or real time use cases
    1. Internet Explorer
    2. Mozilla Firefox
    3. Google Chrome
    4. Opera
    5. Safari

CSS ASSIGNMENT NUMBER: _____________3___________________________________
STUDENT ROLL NUMBER: _______________Sp-2014-MSc-CE-011___________________
STUDENT NAME: ________________________Kashif Islam_________________________

Following comparison is made using automated tools on a machine with following specs:
  • OS: Windows Vista (32-bit)
  • CPU: Intel Core Duo (2.16 GHz)
  • RAM: 3 GB
  • Computer: Dell XPS M1530

Clearly Chrome is the winner in overall performance

Browser
*****
Winner
Java Script Spee

3,440 ms

6,306 ms

542 ms

1231 ms
864ms
chrome
DOM Selection Speed
27 ms
137 ms
139 ms
73 ms
30ms
Opera
CSS Rendering Speed


253 ms
793 ms
91 ms
359 ms

117ms
chrome
Page Load Times
1.5 sec
4 sec
1.45 sec
1.34 sec
1.61 sec
firefox
CPU Usage
11.3%
18.1%
3%
7.6%
4.4%
chrome
Browser Cache Performance

0.76 sec
2 sec
0.72 sec
0.75 sec
0.89 sec
firefox


Conclusion with Standard Deviation

Based on used performance metrics it’s evident that Chrome is overall best browser in terms of performance.

Now if we calculate its variance and standard deviation to determine how better chrome is compared to other browsers.

I will only use CPU usage as performance metric for these calculations

Mean = (11.3+    18.1+    3+    7.6+    4.4 ) /5 = 8.88
Variance =  (5.85 + 9.22 + 34.57 + 1.638  + 20.07)/ 5 = 14.26
Standard Deviation = 3.78


Simulation Modelling and Analysis of Computer Networks Assignment 1


ASSIGNMENT # 01


I will post all my work here for FREE , hoping it would be beneficial for someone in future

If you find it helpful in anyway and want to thank, you can always

donate me on my bitcoin  16moPv4pyFX8etZxiiVAderXFo7pPaH3JE
:

like/share my page  my page www.kashifislamview.blogspot.com


TOTAL MARKS
Question No. 01 (20)
  1. From published literature, select an article or a report that presents results of a performance evaluation study. Make a list of good and bad points of the study. What would you do different if you were asked to repeat the study
  • Suggestion: Each student should select a different system such as a network, database, processor, and so on


    Performance evaluation of cloud application
    With constant data center configuration and
    Variable service broker policy
    Using CloudSim
    Kashif Islam
    Postgraduate Student Dept. Computer Engineering
    CASE, Pakistan
    kashif.islam.se@gmail.com


    Abstract
    Say you are starting a business, a small software company. Lets say 100 employees. Each employee should be provided a separate laptop/desktop. Operating System , along with costly applications should be installed on each system. Your proprietary software should be installed on each system. Now when upgrading , you have to upgrade 100 computers. There will be additional cost of upgrading hardware, faulty equipment replacement ,IT infrastructure etc. Cloud computing presents you with an alternative solution.
    Platfrom as a Service (PaaS), Software as a Service (SaaS) and Infrastructure as a service (IaaS).i.e. instead of buying 100 high performance costly desktop Pcs/laptops. You buy 100 cheap thin clients of netbooks. All your software including OS , will be on the cloud.Microsoft applications , your proprietary software will be in cloud. Now for upgrades you can schedule without any downtime.IT infrastructure cost will be reduced. You will only pay for the time employees are logged in and working. When people are not working they won't be utilizing resources on the cloud hence you won't be charged for this time.Now consider a second example where you build a social networking site. Users from every part of world log in to your side ,upload pictures, movies etc.
    At certain time different number of users logged in are different compared to other. In different Geographical locations. Let’s say at time 00:00 you have 1 million users utilizing system resources of cloud.At peak times you have 30 million users utilizing system resources. Power of cloud is it will expand resources for peak time and would reduce resourced during idle or less traffic thus fruitful for both customer and service provider. Now you know about your company timing, your load, peak load hours, complexity of application etc. Before leasing any cloud service , you want to evaluate performance of your application on cloud.
    There are different softwares available for simulating this. GridSim, CloudSim, GangSim, Micro Grid etc.
    GridSim actually simulates cost and performance for applications distributed applications deployed on cloud computing systems.
    While CloudSim is built on top of Grid Sim softwares is to the date best software for studying cloud computing infrastructures.
    Cloud Analyst built on top of  CloudSim  provides simulating controlled data centre configuration performance based of different metrics.

    Good points of study
    Well Defined Goal:  Goal of study was well defined to evaluate performance of cloud based on different policies for a cloud deployment of social networking application.

    Best Evaluation Technique: Best Evaluation technique currently present is used to simulate the problem.
    Social Aspects Included: Social aspects are included very thoroughly as users from different geographical regions will encounter different latency depending upon the performance metrics selected
    Realistic Workload: A realistic workload is selected in terms of number of users and geographical representation of load is showed in performance calculations.

    Presentation Style: Presentation Style used is suitable even for layman, while briefly including technical details with simplicity.

    Bad points of study
    Statistical in-correction: As a matter of fact huge social networking applications make use of customized SQL database on non-cloud platforms. Use of cloud technology is relatively new and migration costs are higher. Cloud is more effective for small scale applications which grow over time.

    Failing scenarios absent: Study does not include any failure scenarios, e.g hardware failure, network failure, application bugs, infinite loops.

    Security Concern absent: Cloud applications pose a security concern among many customers. Due to this reason customers are reluctant to migrate their Infrastructure to cloud. This paper does not evaluates any security concern with performance measuring. Normally implementing different security mesaures have considerable overhead on performance in terms of network and processing delay.


    What would I do different

    Include Application complexity factor. Author has not included application complexity factor in his research. Depending upon application complexity, latency can play a huge role in cloud apps.

    Include Customized number of Threads in Evaluation Techniques: If you are playing a heavy game , e.g let’s say Strong Hold Crusader on a cloud platform. Latency of some factors might be of less importance compared to others.
    e.g map navigation should become most efficient in terms of latency compared to selection of units.

    Better analysis and interpretation of data: If I would do research I would actually include analysis of different services offered  by the platform which are interdependent  on other cloud apps and represent data in terms of relational model.

    REFERENCES

  • Android Anti-forensics: Modifying CyanogenMod  http://arxiv.org/abs/1401.6444 , Jan 2014
Performance evaluation of cloud application with constant data center configuration and variable service broker policy using CloudSim  International Journal of Enhanced Research in Science Technology & Engineering, ISSN: 2319-7463
Vol. 3 Issue 1, January-2014, pp: (1-5), Impact Factor: 1.252, Available online at: www.erpublications.com


I will post all my work here for FREE , hoping it would be beneficial for someone in future

If you find it helpful in anyway and want to thank, you can always

donate me on my bitcoin  16moPv4pyFX8etZxiiVAderXFo7pPaH3JE
:

like/share my page  my page www.kashifislamview.blogspot.com


Simulation Modelling and Analysis of Computer Networks Assignment 2


Question No. 01 (20)
Select an area of computer systems (for example, processor design, networks, operating systems, or databases), review articles on performance evaluation in that area and make a list of benchmarks used in those articles.


Question No. 02 (30)
Make a complete list of metrics to compare

  • Two personal computers
  • Two database systems
  • Two disk drives
  • Two window systems


Best of luck

CSS ASSIGNMENT NUMBER: ___________2___________________________
STUDENT ROLL NUMBER: ___Sp-2014-MSC-CE 011___________________
STUDENT NAME: ______________Kashif Islam ________________________


Area Selected: Android Systems Performance Evaluation


Articles Reviewed:


  • Performance Analysis of Android Underlying Virtual Machine in Mobile Phones


  • Catch Me if You Can  Evaluating Android Anti-malware against Transformation Attacks
  • Evaluating Performance of Android Platform Using Native C for Embedded Systems
  • Sleeping Android: Exploit through Dormant Permission Requests
  • Measuring and Improving Application Launching Performance on Android Devices
  • Analysis of Android Malware Detection Performance using Machine Learning Classifiers


  • Enhancing Performance of Traffic Safety Guardian System on Android by Task Skipping Mechanism


  • Performance Analysis of Android Underlying Virtual Machine in Mobile Phones


SUT: Android
CUS: DVM
Analysis Method: Measurement and simulation
Profiling is not available in android so to measure performance “Debug” and “VmDebug” default libraries are used.


Benchmark used:
Finding a benchmark was a challenge here.
Benchmark uses should also be using DVM.
Benchmark chosen should have its source code available.
So from Android SDK seven common and popular applications were chosen and three default android applications were chosen which include Camera, Music Player and Calculator as a benchmark for comparing performance of DVM.


  • Catch Me if You Can  Evaluating Android Anti-malware against Transformation Attacks


This is most interesting paper for evaluating Anti-malware software performance on android.


SUT: Android Anti malware softwares
CUS: Transformed Anti Malwares
Analysis Method: Measurement and simulation
Benchmark used:
Malware detection against following transformation metrics:


  •  Evaluating Performance of Android Platform Using Native C for Embedded Systems
SUT: NDK
CUS: JNI vs native JAVA
Analysis Method: Measurement only
Benchmark used: JNI was used as benchmark in this study and native Java performance was measured against it.
Performance metrics:
  • JNI communication delay
  • Integer Calculation
  • Floating Point Calculation
  • Memory Access Algorithms
  • Heap Memory Allocation Algorithms


Results show that native C/C++ used through JNI has better performance against all metrics except for memory access algorithms.
In Memory Access Native Java performs better than JNI in android.


  • Measuring and Improving Application Launching Performance on Android Devices


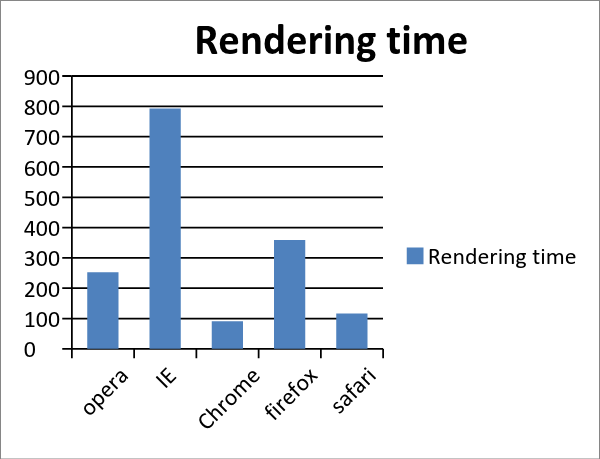
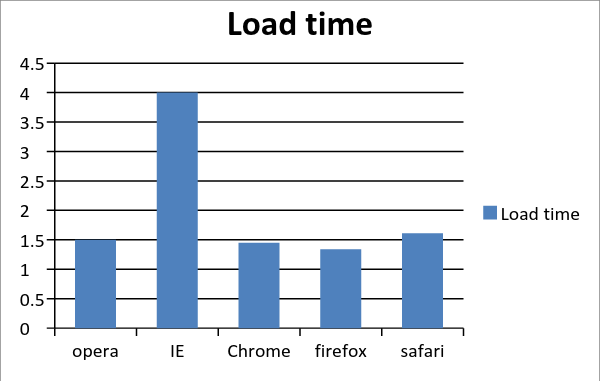
SUT: Android Applications
CUS: Launching Speed and Performance
Analysis Method: Measurement and Simulation
Performance Metric: Launch time
Benchmark used: Default preload and no preload of classes were used as a benchmark against +51 classes , +120 classes and +281 classes.
Results:
  • Analysis of Android Malware Detection Performance using Machine Learning Classifiers


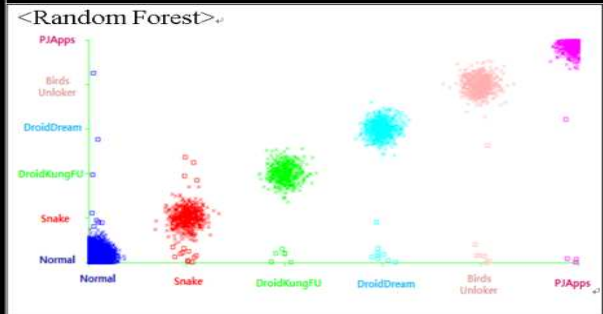
SUT: Android Malwares and their detection using MLCs
CUS: Machine Level Classifiers Performance
Analysis Method: Measurement and Simulation
Performance Metric: True Positive Rate, False Positive Rate,Precision,
Workload : Malwares GoldDream, PJApps, DroidKungFu2, Snake, Angry Birds Rio
Unlocker
Benchmark selected: Naïve Bayesian, RandomForest, Logistic Regression, SVM: Support Vector Machine
Result : Shown interms of confusion matrix.


  • Enhancing Performance of Traffic Safety Guardian System on Android by Task Skipping Mechanism


SUT: Traffoc Safety Guardian System on Android
CUS: TSG frames
Metrics: Car detection speed and fps
Workload: moving cars and highway lines
Benchmark: original fps without Task Skipping
Result: increased fps by using task skipping and JNI
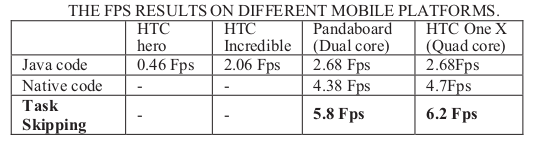
Conclusion
Performance comparison in android devices still lacks analytical method. Mostly performance analysis is conducted using measurement or simulation which is time consuming. Benchmarks used for performance analysis are native implementations without suggested improvements and these are then compared with results of improvement implemented schemes / apps.


About the Author.
8 years’ experience in Nokia Siemens Networks and Ericsson, Intelligent Networks and Charging Systems
Humanist, philanthropist and Technologist
References


  1. Performance Analysis of Android Underlying Virtual Machine in Mobile Phones ieeexplore.ieee.org/xpl/articleDetails.jsp?arnumber=6336470
  2. Catch Me if You Can Evaluating Android Anti-malware against Transformation Attacks
ieeexplore.ieee.org/xpl/articleDetails.jsp?arnumber=6661334


  1. Evaluating Performance of Android Platform Using Native C for Embedded Systems
ieeexplore.ieee.org/xpls/abs_all.jsp?arnumber=5669738


  1. Sleeping Android: Exploit through Dormant Permission Requests
www.ma.rhul.ac.uk/static/techrep/2013/MA-2013-06.pdf
  1. Measuring and Improving Application Launching Performance on Android Devices
ieeexplore.ieee.org/xpls/abs_all.jsp?arnumber=6726978
  1. Analysis of Android Malware Detection Performance using Machine Learning Classifiers
ieeexplore.ieee.org/xpls/abs_all.jsp?arnumber=6675404
  1. Enhancing Performance of Traffic Safety Guardian System on Android by Task Skipping Mechanism
ieeexplore.ieee.org/xpls/abs_all.jsp?arnumber=6570137
Question No. 02 (30)
Make a complete list of metrics to compare


  • Two personal computers
  • Two database systems
  • Two disk drives
  • Two window systems


  • Performance metrics to compare Two personal computers


Throughput: Processing speed, Memory speed, bus speed.
Response time: boot time, disks RPM / IO speed battery Discharge Curve
Resource: Disk and memory capacity, number of ports. Display technology used (LCD or LED)


In addition to above following are performance metrics of individual components for comparing two PCs


CPU performance metrics: clocking speed,L1/L2/L3 cache size
Graphics card performance metrics: Graphics Processing Clusters, Streaming Multiprocessors,CUDA Cores, Texture Units,ROP Units, Base Clock, Boost Clock, Memory Clock (Data rate),L2 Cache Size, Total Video Memory, Memory Interface, Total Memory Bandwidth, Texture Filtering Rate (Bilinear),Fabrication Process used, Transistor Count, Connectors used, Form Factor, Power Connectors quality, Thermal Design Power (TDP),Thermal Threshold


  • Metrics to compare Two database systems


Throughput: TPS, w/s ,r/
Response time: indexing time, query time, loading time, database lock time, measuring concurrent operations and lock percentage. Crash recovery time , connection time, Deadlock discovery and resolution time
Resource Resources consumed in Journaling, processing overhead, I/O on underlying disks (supported block size), load on db server, load on network


In addition to above following performance metrics can be used depending upon SUT


Schema comparison
Timeliness and freshness of data metrics under multiple load conditions.


I plan to compare Berkeley DB, MongoDB and oracle in future provided research yields financial benefits


  • Metrics to compare Two disk drives


Throughput: Short stroking
Response time: Seek time, Data transfer rate, Media rate, Sector overhead time, Head switch time, Cylinder switch time,
Resource: power consumption,
Magnetic material lifetime, size, weight, shock absorbent quotient value


Audible noise, Shock resistance,
  • Performance Metrics to compare Two window systems


Startup time


Backwards compatibility, Software compatibility,


File copy operations (newer windows system is more optimized)


CPU Usage,cores,


Memory management. Display, graphics


Security, Data execution prevention, Netbook support


Availability of official support, BranchCache support (new feature to speed network ,absent in older versions)


Minimum Resources constraint ( e.g older windows could run on lower slower processors and does not require much RAM)


Kernel type (hybrid or native)


Platform support (supports both 32 and 64  architectures or only one of them)


Physical Memory Limits
About the Author.
8 years’ experience in Nokia Siemens Networks and Ericsson, Intelligent Networks and Charging Systems
Humanist, philanthropist and Technologist